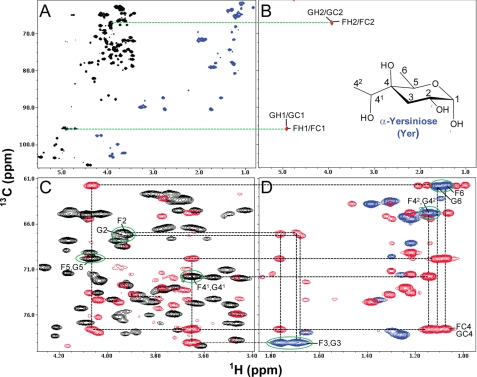
FIGURE 9.
HMQC (A) and selective-TOCSY-HSQC (B) as well as HMQC and HMBC overlays (C and D) of the heteronuclear NMR spectra of the wild-type V. fischeri O-antigen oligosaccharide. These data illustrate the assignments of the spin systems for the sugar residues F and G of Yer. A, HMQC spectrum is shown in black for the positive peaks and blue for the folded negative peaks. B, selective-TOCSY-HSQC spectrum, shown in red, was obtained using a selective excitation pulse at the H1 positions of the sugar residues F and G with a selective TOCSY mixing time of 120 ms. C and D, HMQC spectrum is shown in black for the positive peaks and blue for the folded negative peaks, and the HMBC spectrum is shown in red. The peaks are labeled with the following convention, i.e. the 1st letter in the labels refers to sugar subunit, and the rest of the labels refers to the position on that sugar residue. The green circled peaks in C and D indicate the HMQC cross-peaks derived from the sugar residues F and G of Yer. The dotted lines indicate the spin connectivities for these residues. F41 (or G41) and F42 (or G42) indicate the first and second positions, respectively, of the group attached to the 4th carbon on the sugar residue F (or G). FC4 and GC4 indicate the cross-peaks derived from the C4 carbon of the residues F and G, respectively. The α-Yer structure and the position labeling are indicated in B.

