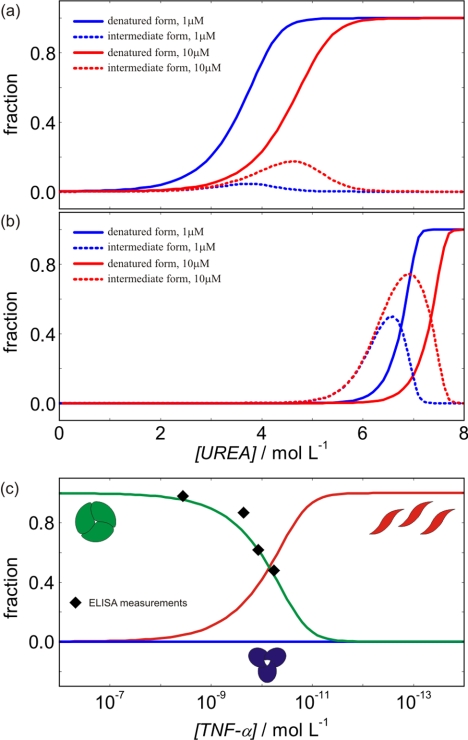
FIGURE 7.
Population of different TNF-α and TNF-α-Fab complex forms at various conditions at 37 °C. a and b, population of TNF-α forms (a) and population of the TNF-α-Fab complex forms (b) at different urea and protein concentrations. c, population of different forms of TNF-α in the absence of urea as a function of TNF-α concentration. Black diamonds represent the values measured by ELISA (Corti et. al. (11)).

