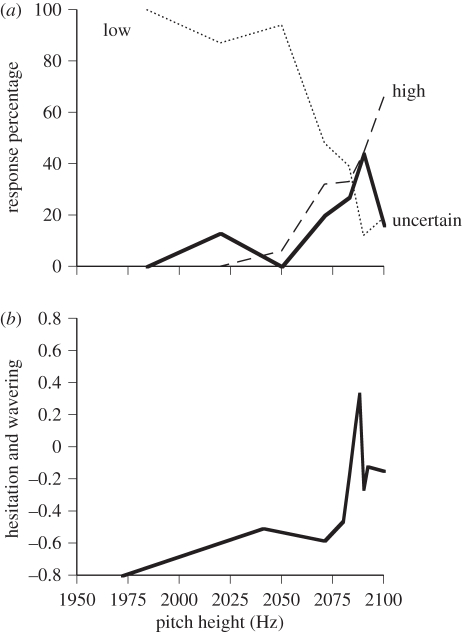
Figure 1.
(a) Performance by a dolphin in an auditory discrimination [16]. The dolphin swam to touch a ‘low’ or ‘high’ response. In addition, he could make an ‘uncertain’ response to decline the trial. The pitch of the low tones was adjusted dynamically to titrate the dolphin's perceptual limit for distinguishing low and high tones, and to examine his response pattern in detail within this region of maximum difficulty. The horizontal axis indicates the frequency (Hz) of the trial. The low and high response, respectively, was correct for frequencies of 1200–2099 Hz and 2100 Hz. The latter trials are plotted as the rightmost data point for each curve. The solid line represents the percentage of trials receiving the uncertainty response at each pitch level. The percentage of trials ending with the low response (dotted line) or high response (dashed line) are also shown. (b). Four raters judged how much the dolphin slowed, wavered and hesitated for the trials within four video-taped sessions. Factor analysis was used to discern the simpler structure behind the four sets of ratings. The figure shows the dolphin's weighted overall factor 1 behaviour (hesitancy, slowing and wavering) for tones of different frequencies (Hz). Reprinted with permission from Smith et al. [16, p. 399, 402]. Copyright © 1995 by the American Psychological Association.

