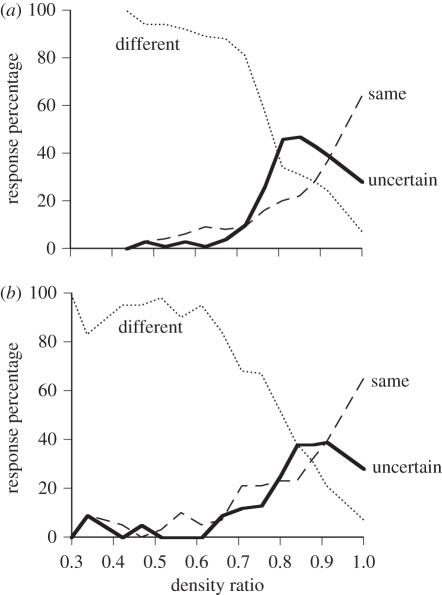
Figure 2.
(a) Performance by monkeys in a same–different discrimination [15]. The monkeys manipulated joysticks to make different or same responses, respectively, when two pixel boxes had the same or different internal density of lit pixels. In addition, they could make an uncertainty response to decline the trial. The pitch of the density difference on different trials was adjusted dynamically to titrate the monkeys’ perceptual limit for distinguishing sameness from difference and to examine their response patterns in detail within this region of maximum difficulty. The horizontal axis gives the ratio between the densities of the two pixel boxes seen on each trial. The same response was correct for ratio 1—these trials are plotted as the rightmost data point for each curve. The different response was correct for all other trials. The solid line represents the percentage of trials receiving the uncertainty response at each density ratio. The percentages of trials ending with the different response (dotted line) or same response (dashed line) are also shown. (b) Performance by humans in the same–different discrimination, depicted in the same way. Reprinted with permission from Shields et al. [15, p. 158]. Copyright © 1997 by the American Psychological Association.

