Figure 3.
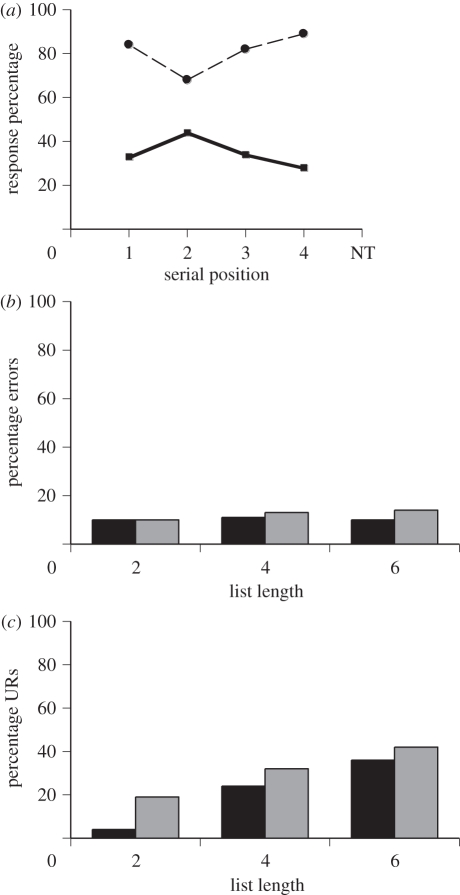
(a) Performance by a macaque in a metamemory task [18]. NT denotes ‘not there’ trials in which the probe picture was not in the memory list of pictures. The serial position (1–4) of the probe picture in the list of pictures on ‘there’ trials is also given along the x-axis. The percentage of each type of trial that received the uncertainty response is shown (solid line with squares). The percentage correct (of trials on which the memory test was attempted) is also shown (dashed line with circles). Macaques responded ‘uncertain’ most for the trials on which their memories were most indeterminate. (b) Percentage error rates by two monkeys (black and grey bars) when the difficulty of the memory test was increased by increasing the memory list from two to six pictures. (c) Percentage uncertainty responses (URs) by two monkeys when the difficulty of the memory test was increased in the same way. Reprinted with permission from Smith et al. [18, p. 236, p. 238]. Copyright © 1998 by the American Psychological Association.

