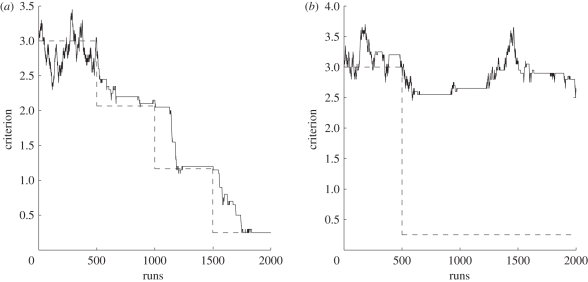
Figure 4.
(a) Scenario 1: detection criterion (here for stimulus A) approaches and remains near optimal value with repeated iterations of the learning algorithm, following each small reduction in the strength of the target present distribution. (b) Scenario 2 (blindsight): detection criterion jitters around initial value even after repeatedly applying the learning algorithm, following a drastic reduction in the strength of the target present distribution. Dashed lines represent optimal value.

