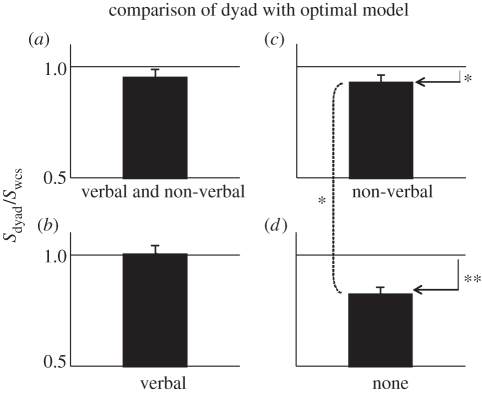
Figure 6.
Optimality of dyad performance in each condition of experiment 2. Panels correspond to the conditions illustrated in figure 3. Horizontal line indicates that group performance was at the level predicted by the WCS model. *p < 0.05; **p < 0.01.

