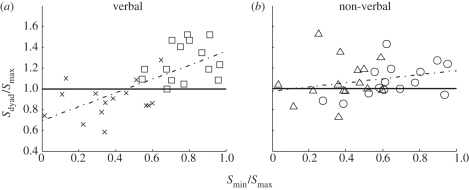
Figure 7.
The relationship between collective decisions and similarity of dyad members’ sensitivity. Each panel shows the relationship between collective benefit (sdyad/smax) and similarity (smin/smax; see §4a). (a) Data from experiments with exclusive verbal communication mode (cross symbols: verbal condition in experiment 1; squares: verbal condition in experiment 2). (b) Data from experiments with exclusive non-verbal communication mode (triangles: non-verbal condition in experiment 1; circles: non-verbal condition in experiment 2).

