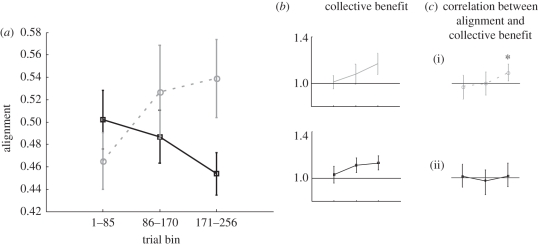
Figure 8.
(a) Alignment of confidence plotted for each time bin consisting of one-third of the trials. Black symbols and curve correspond to the verbal and non-verbal condition in experiment 2 where both participants communicated verbally and used the confidence rating schema. Grey symbols and curve correspond to the non-verbal condition in experiment 2, where participants only communicated via the confidence rating schema. Error bars are 1 s.e.m. across dyads (n = 15). (b) Collective benefit (sdyad/smax) is plotted for each bin. Horizontal line indicates no benefit (i.e. sdyad = smax). Error bars are 1 s.e.m. across dyads (n = 15). (c) Correlation coefficients between alignment and collective benefit across dyads for each time bin. For V&NV condition (ii), (Pearson r = [0.08, −0.15, 0.11] and all p > 0.55. For NV condition (i), Pearson r = [0.1, −0.01, 0.6] and p = [0.7, 0.9, 0.01]. Horizontal line indicated zero. Departure from null hypothesis (p = 0.01) is marked by asterisk. Error bars are 95% CIs for Pearson correlation using Fisher transformation [33] (http://bit.ly/pvDx9).

