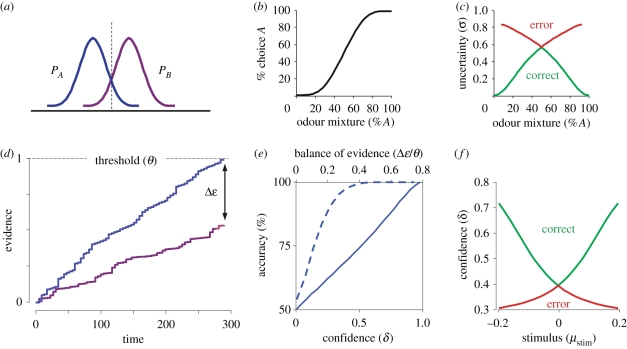
Figure 3.
Computational models for choice and confidence. (a–c) Bayesian signal detection theory model. (a) The two stimulus distributions, A and B. (b) Psychometric function. (c) Predictions for confidence estimate as a function of observables. (d,e) Dual integrator, race model. (d) Schematic showing the accumulation of evidence in two integrators up to a threshold. Blue line denotes evidence for A and purple line denotes evidence for B. (e) Calibration of ‘balance of evidence’ yields veridical confidence estimate. (f) Prediction for confidence estimate as a function of observables.

