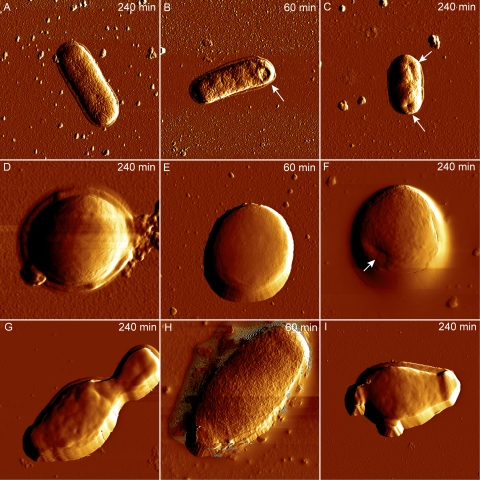
Fig 2.
AFM amplitude images of E. coli (A to C), S. xylosus (D to F), and Z. bailii (G to I) cells recorded in air after exposure to monocaprylate. The untreated cells (A, D, G) were incubated 240 min in MOPS. Cells treated with 20.4 mM (B and C), 18 mM (E and F), or 8 mM (H and I) monocaprylate for 60 min (B, E, and H) or 240 min (C, F, and I). White arrows indicate visible changes in cell structure. Images of E. coli, S. xylosus, and Z. bailii were 5 by 5 μm, 2 by 2 μm, and 10 by 10 μm, respectively.

