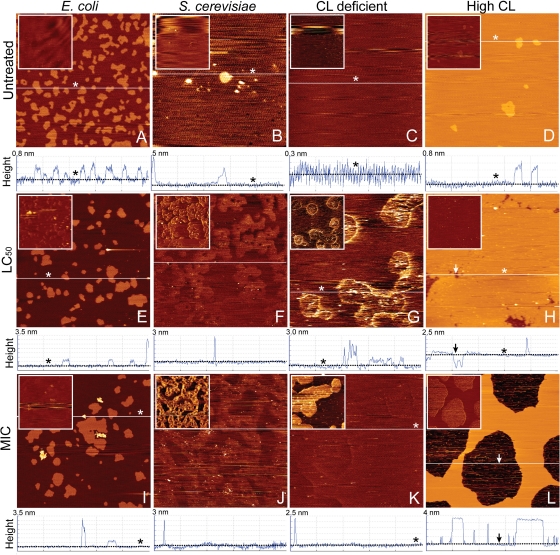
Fig 6.
Contact mode AFM height images of monocaprylate's effect on SLBs from E. coli and S. cerevisiae recorded in MOPS. Representative images of untreated SLBs of E. coli lipid (9.8% CL) (A), S. cerevisiae lipid (B), E. coli lipid without cardiolipin (C), and E. coli lipid with high cardiolipin content (20% CL) (D). Untreated SLBs were exposed to monocaprylate for an hour at a final concentration corresponding to LC50 (5 mM [E, G, H], 7 mM [F]) and MIC (10.2 mM [I, K, L], 4 mM [J]). The SLBs were rinsed with MOPS before imaging. Below each height image is a cross-sectional profile taken at the white line in the corresponding images. The liquid disordered lipid phase and holes are illustrated with asterisks and arrows, respectively. In the 5- by 5-μm height images, the lighter areas correspond to higher structures. The insets are vertical deflection images of the same area as the corresponding height image; lighter areas correspond to higher lateral friction between tip and sample.

