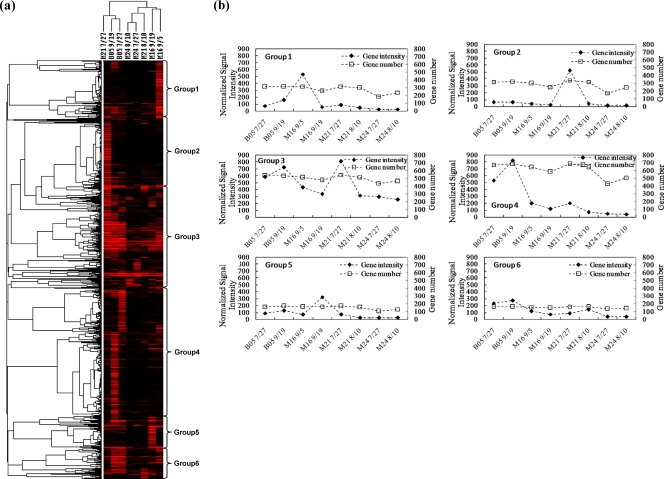
Fig 2.
Hierarchical cluster analysis of all functional genes detected (a). Genes that were present in at least three time points were used for cluster analysis. Results were generated in CLUSTER and visualized using TREEVIEW. Red indicates signal intensities above background, while black indicates signal intensities below background. Brighter red coloring indicates higher signal intensities. A total of 6 major groups were observed (b). The numbers equal groupings found among the hybridization patterns.

