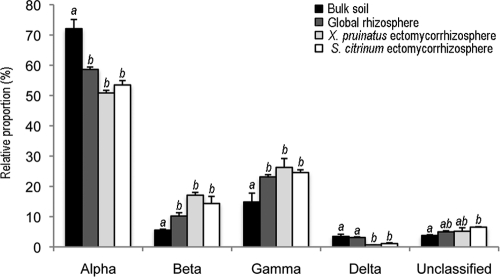
Fig 1.
Relative abundances of Proteobacteria in the ectomycorrhizosphere, the rhizosphere, and the surrounding bulk soil. A one-factor (habitat) ANOVA was applied on the relative distribution values after an arcsine square root transformation for each proteobacterial group. Different letters for each proteobacterial group indicate that the values are significantly different.

