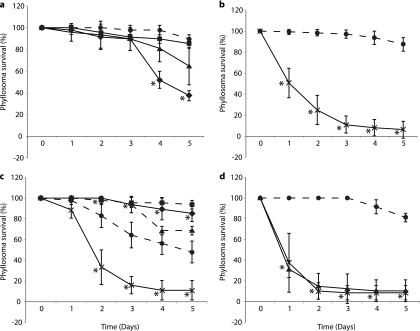
Fig 1.
Survival of P. ornatus phyllosomas experimentally infected with V. owensii DY05 by immersion (a) or vectored challenge via Artemia nauplii (b to d). (a) Stage 1 phyllosoma survival after immersion with V. owensii DY05 at concentrations of 0 (control; ●), 1 × 10³ (■), 1 × 10⁵ (▲), and 1 × 10⁷ (♦) CFU ml−1. Data from one of three independent experiments are presented, as high interexperimental variability prevented pooling of data. (b) Stage 1 phyllosoma survival after vectored challenge with nonenriched nauplii (control; ●) or nauplii enriched with V. owensii DY05 (×). Pooled data from three independent experiments are presented. (c) Stage 3 phyllosoma survival after vectored challenge with nonenriched nauplii (controls; ●, ■, and ▲) or nauplii enriched in V. owensii DY05 (×). Data from three independent experiments are shown; data for controls were not pooled due to high interexperimental variability, while data for V. owensii-challenged phyllosomas were pooled. The first experiment (control; ●) included a second control treated with an antibiotic cocktail (♦) prior to feeding with nauplii. (d) Stage 1 phyllosoma survival after vectored challenge with nonenriched nauplii (control; ●) or nauplii enriched with V. owensii DY05 (×) or DY05[GFP] (▲). The asterisks indicate data points significantly different (Student's t test) from the corresponding control. Means ± standard deviations (SD) are shown.

