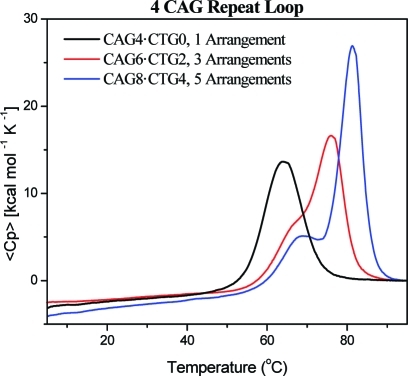
Figure 1.
Excess heat capacity curves measured for a repeat loop construct composed of four CAG repeats located in a fixed position (black) or distributed between three (red) or five (blue) equivalent loop positions. Similar results were obtained for different CAG loop sizes and for CTG repeat loops in multiple equivalent loop positions.

