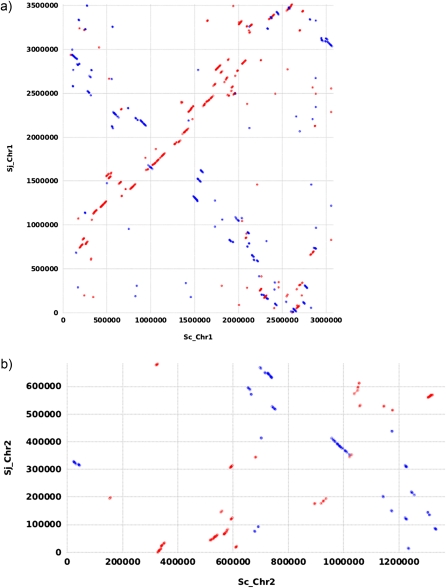
FIG. 5.—
Scatter plot of gene conservation in chromosomes 1 and 2 of Sphingobium chlorophenolicum and Sphingobium japonicum. Red dots correspond to pairs of ORFs found when the two chromosomes are compared directly and blue dots to pairs of ORFs found when one genome is aligned to the reverse complement of the other.

