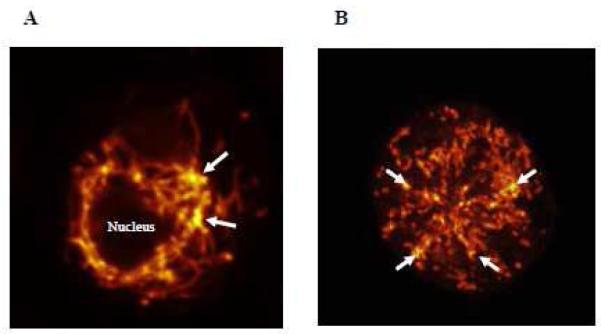
Figure 5.
Two human cultured LAD2 mast cells, showing distribution of mitochondria stained with MitoTracker and photographed using Confocal microscopy; (A) control in which mitochondria form a “net” around the nucleus and (B) after stimulation with SP (2 M for 30 min at 37°C) in which mitochondria are distributed throughout the cell. (Magnification: x 1000). Arrows point to the areas with the highest concentration of MitoTracker (yellow color); thus the highest aggregation of mitochondria.

