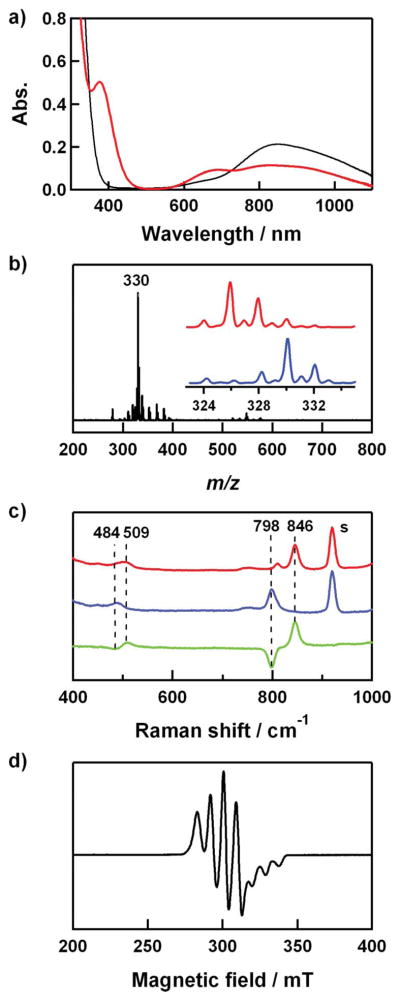
Fig. 2.
(a) UV-vis spectra of 1 (0.4 mM) (black line) and 2 (0.4 mM) (red line) in CH3CN/CH3OH (1:1) at 0 °C. (b) ESI-MS of 2-18O. Inset shows isotope distribution patterns for 2-18O (blue line) and 2-16O (red line). (c) Resonance Raman spectra of 2 (4 mM) obtained upon excitation at 407 nm in CH3CN/CH3OH (1:1) at −20 °C. Red/blue lines: samples prepared with H216O2/H218O2; green line: difference spectrum, (16O–18O). The peak marked with “s” is ascribed to the solvents. (d) X-band EPR spectrum of 2 recorded in CH3CN/CH3OH (1:1) at 4.3 K. Spectroscopic settings: frequency = 9.10 GHz, microwave power = 1 mW, modulation frequency = 100 kHz.

