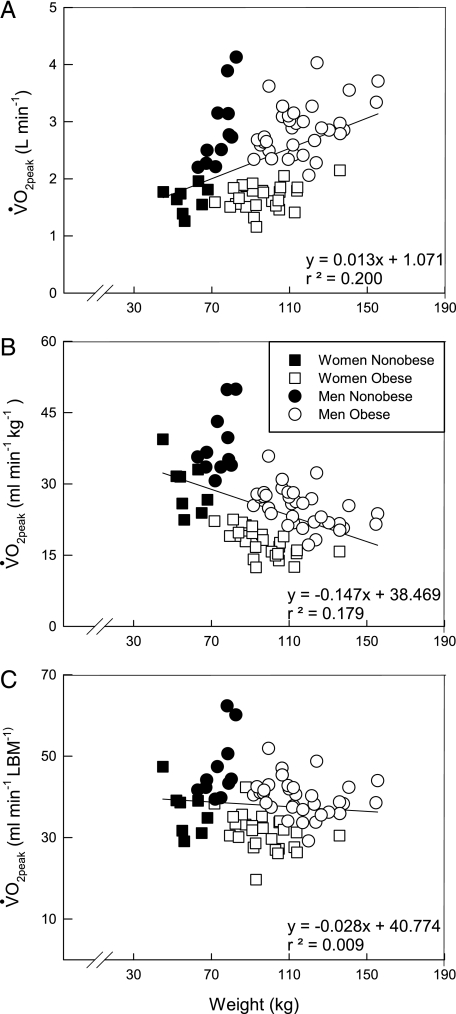
Figure 1.
Individual data showing the effect of body weight on o2peak. A, Displayed in absolute terms (L/min). B, Displayed relative to body weight (mL/min/kg). C, Displayed relative to LBM (mL/min/LBM). Solid line represents regression line for all subjects. o2peak = peak oxygen uptake; LBM = lean body mass.

