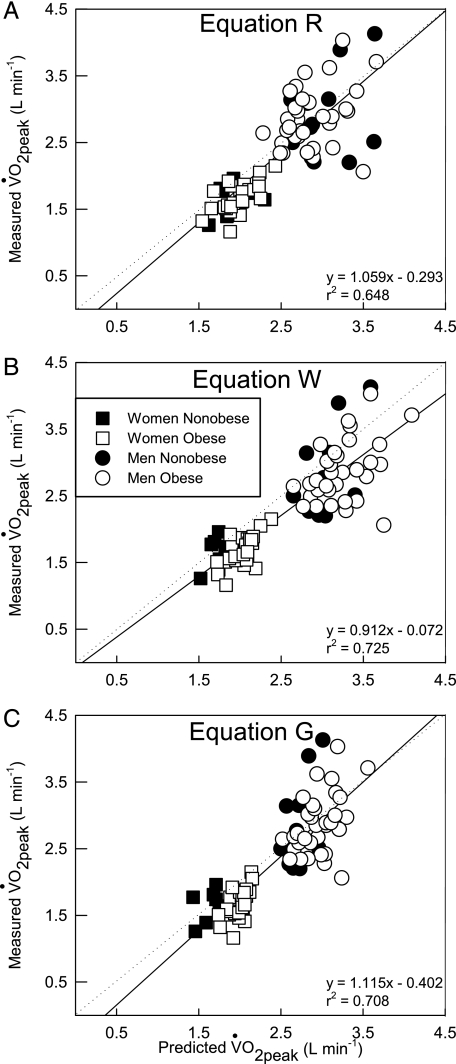
Figure 4.
Relationship between each prediction method with the measured o2peak data for all individuals. A, Equation R. B, Equation W. C, Equation G. Straight line and dotted line represent the regression line and line of equality, respectively. See Figure 1 legend for expansion of abbreviation.

