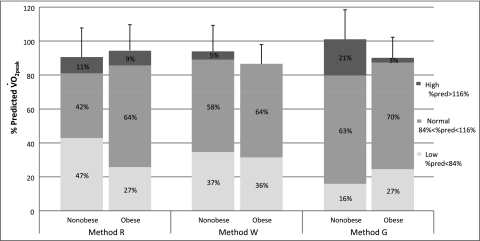
Figure 7.
Overall cardiorespiratory fitness in the nonobese and obese groups. Group bars (ie, Nonobese or Obese within each method) correspond to the o2peak % predicted values (y-axis) for each group. Categories were determined as follows: low = o2peak % predicted < 84%; normal = 84% < o2peak % predicted < 116%; high = % predicted o2peak > 116%. Numbers inside bars represent the overall percentage of each category. See Figure 1 legend for expansion of abbreviation.

