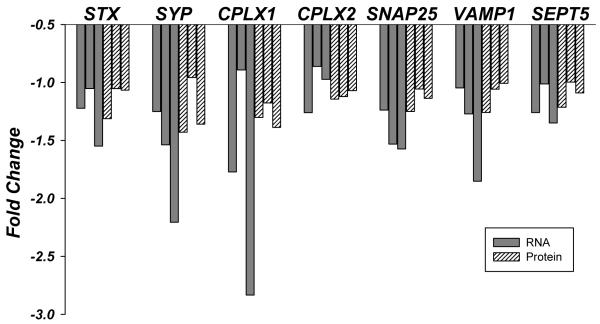
Figure 1.
Changes of mRNA (gray bars) and protein (pattern bars) levels of seven synaptic markers in the superior temporal gyrus of demented subjects as a function of three age tertiles: from left to right young-old, middle old and oldest old. Fold change represents ratio of the means of mRNA or protein levels between non-demented and demented subjects. Corresponding p-values for dementia, age, or the interaction of dementia by age are shown in the Table 3.

