
FIGURE 1. Patterns of Coactivation Correlations (Kendall’s tau b) Between Frontal, Thalamic, and Limbic Regions of Interesta.
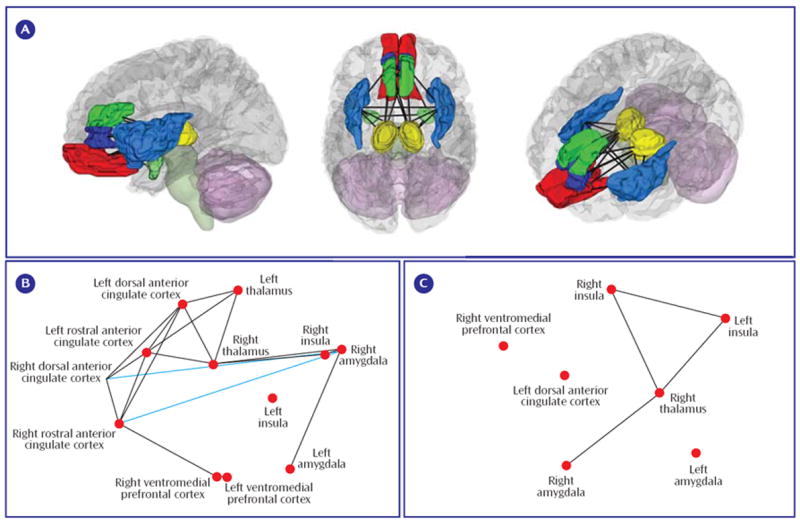
a (A) Three-dimensional rendering of the regions of interest and lines indicating significant coactivation correlations across the entire meta-analysis data set. (B) Patterns of coactivation correlations in either the positive (black lines) or inverse (blue lines) direction for the PTSD comparisons. (C) The same as for B, but for the combination of the social anxiety disorder and specific phobia data sets. For B and C, regions of interest are plotted along dimensions of the first two principal components on the x and y axes, respectively (axes not shown). Coactivation lines represent p<0.05, uncorrected.