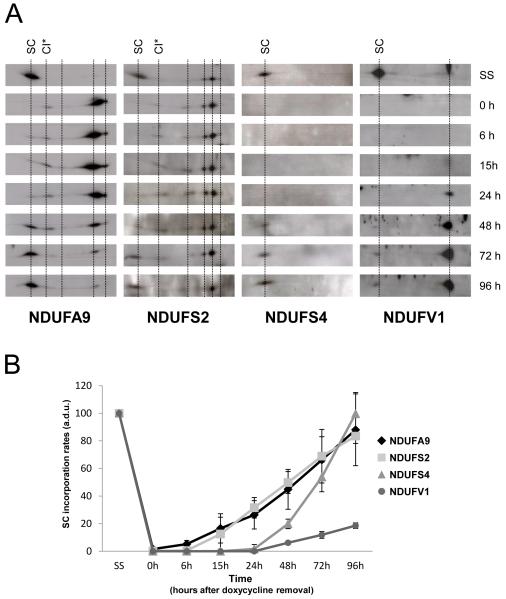
Figure 2. Incorporation rates of individual complex I subunits in supercomplexes.
(A) Example of 2D-BN/SDS-PAGE western blot analysis in doxycycline-treated 143B cells using antibodies against the indicated CI subunits. SC, supercomplexes containing CI, CIII and CIV. CI*, partially-assembled CI. (B) Mean incorporation rates of CI subunits in large supercomplexes (SC). The signals corresponding to CI subunits were quantified in duplicate gels per cell line, and normalized by the CII SDHA subunit. (a.d.u.), arbitrary densitometric units. Mean values are expressed as percentages relative to untreated cells (SS). Error bars represent standard deviations (SD).

