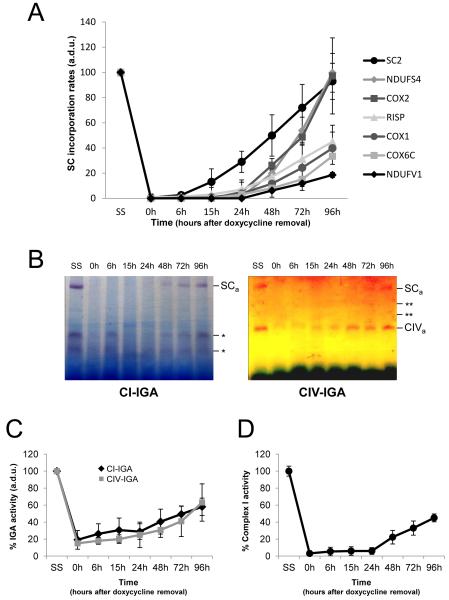
Figure 5. Comparative analysis of the incorporation rates of RC subunits into large supercomplexes.
(A) Mean incorporation rates of RC subunits into I+III2+IVn supercomplexes (SC). SC2 represents the mean incorporation rates of NDUFA9, NDUFS2, CORE2, COX4 and COX5A subunits into SC. (B) 60 μg of crude mitochondrial pellets from the doxycycline assays were analyzed by BN-PAGE in combination with in-gel activity (IGA) assays. The left panel shows a CI in-gel activity (IGA) assay, where * indicate unspecific bands with NADH dehydrogenase activity. The right panel shows a CIV IGA assay. ** indicate the putative CIV dimer (CIV*) and supercomplex III2+IV that stained for CIV activity (CIVa). SCa indicates CI and CIV activities in large supercomplexes. (C) Densitometric analysis of the CI and CIV SCa bands performed in three independent experiments. (D) Spectrophotometric CI activities in digitonin-treated 143B cells. Triplicate measurements were normalized by the citrate synthase activity. (a.d.u.), arbitrary densitometric units. Mean values represent percentages relative to untreated cells (SS). Error bars represent standard deviations (SD).

