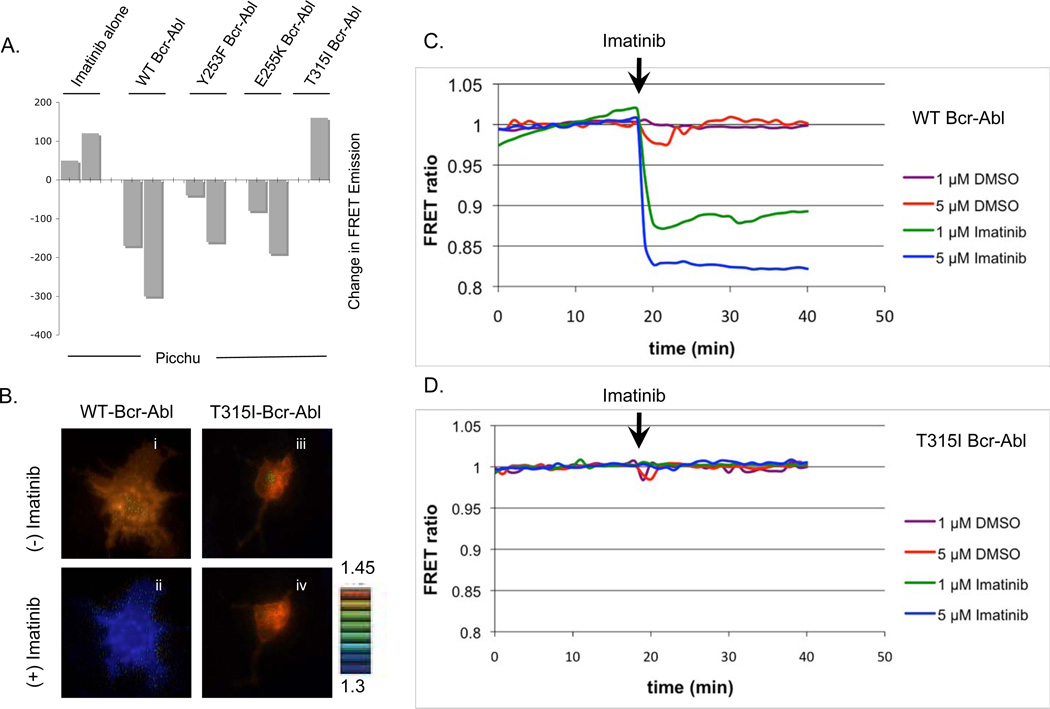
Figure 3. (A) Effect of Bcr-Abl tyrosine kinase mutations on Picchu FRET.
Phosphorylation of the Picchu probe by Bcr-Abl and the corresponding changes in FRET emissions after Imatinib treatment. Bars correspond to duplicate samples, only one sample is shown for T315I mutant in this experiment. (B) Real time FRET microscopy demonstrating pseudocolor visualization of the change in FRET emission after the addition of 5 µM Imatinib for WT Bcr-Abl (panels i and ii) and the T315I mutant (panels iii and iv). See supplemental real player movie SFig 1 and SFig 2 for real-time kinetics as well as the accompanying supplemental graph, SFig3, depicting FRET tracking for each cell in SFig2. (C and D) Real-time microscopic “tracking” of FRET emissions in CosE37 cells expressing wild type Bcr-Abl (C) and T315I Bcr-Abl (D). DMSO (as control) or Imatinib was added at minute 19. Multi-cell FRET tracking can be found as supplemental data, SFig4.

