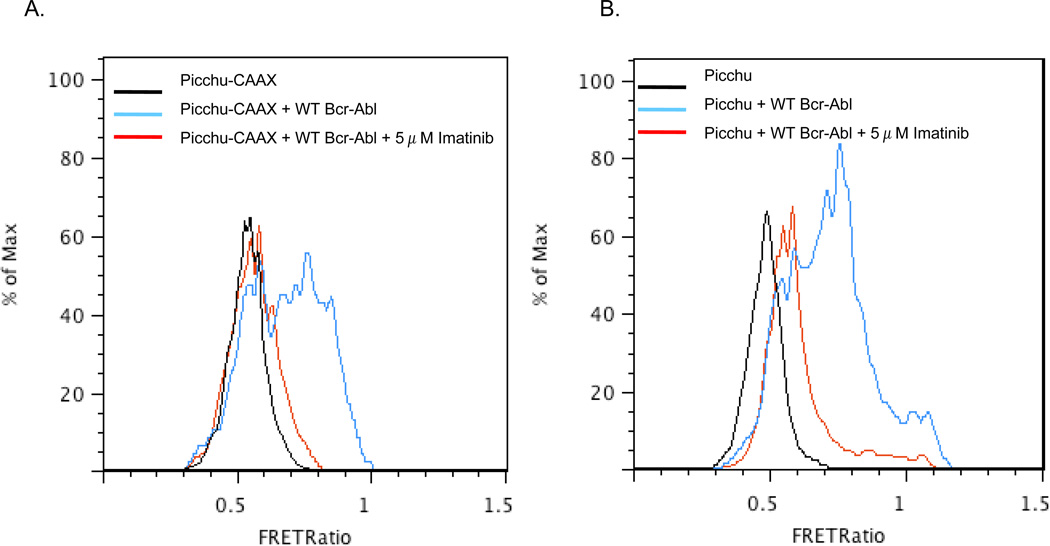
Figure 4. Analysis of ΔFRET ratios by FACS.
Flow cytometric analysis indicating the FRET YFP/CFP ratio in populations of cells with Picchu-CAAX alone (black), with Picchu-CAAX and Bcr-Abl (blue), and with Picchu-CAAX + Bcr-Abl followed by 5 µM Imatinib treatment (red). In panel B, a soluble form of Picchu was used while in panel A, a membrane targeted CAAX-fused version of Picchu was used. Note that both Picchu isoforms are highly labile to Imatinib.

