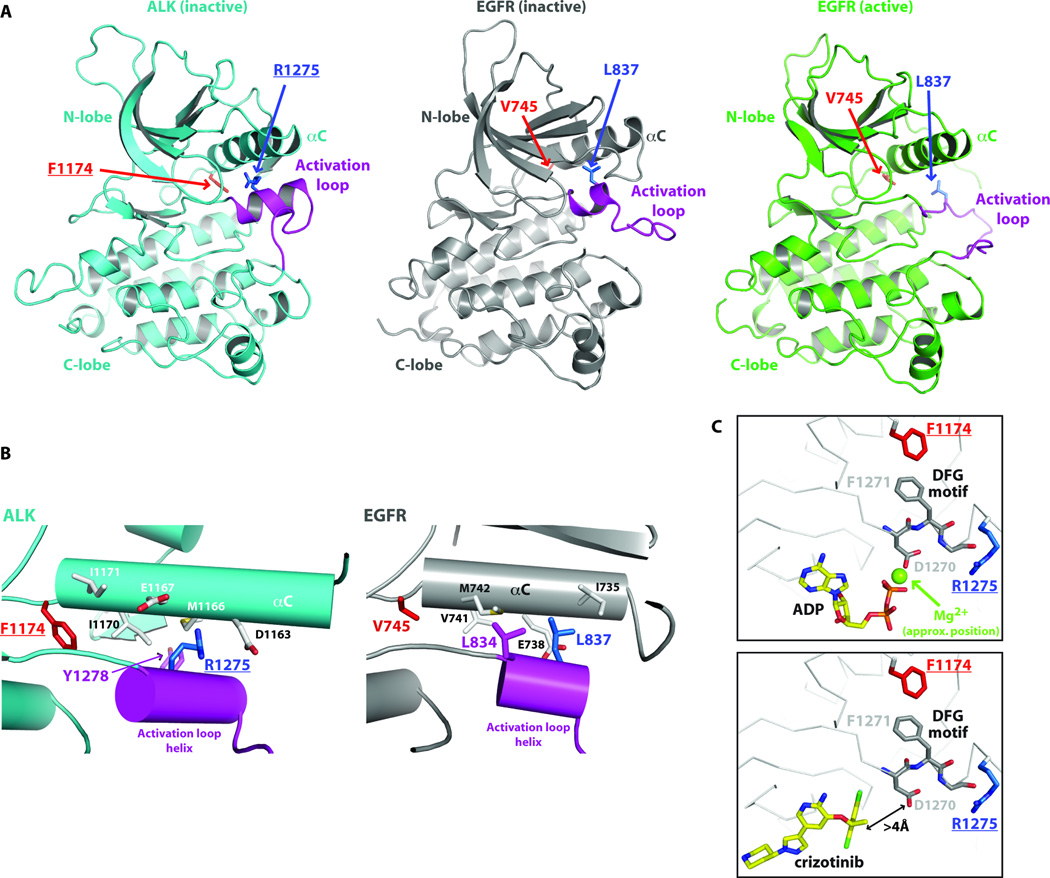
Fig. 6. Structural basis for ALK-TKD activation by F1174L and R1275Q mutations.
(A) Cartoon representations of inactive ALK-TKD (26) from PDB entry 3LCS (cyan), inactive EGFR-TKD (23) from PDB entry 2GS7 (grey), and active EGFR from PDB entry 1M14 (green). The activation loop is colored magenta in each structure. Positions of F1174 (red) and R1275 (blue) are marked in ALK-TKD, as are their structural equivalents in EGFR (V745 and L837). (B) Detail of interactions between the short activation loop helix (magenta) and helix αC in inactive ALK-TKD (left) and inactive EGFR-TKD (right). (C) Close-up of relationship between F1174 side chain, the ‘DFG motif’ and ATP/drug binding site. In the upper panel, taken from PDB entry 3LCT (26), which contains bound ADP, an Mg2+ ion (not reported in this structure) was placed based on its location in the active insulin receptor TKD. Lower panel (with bound crizotinib) taken from PDB entry 2XP2.

