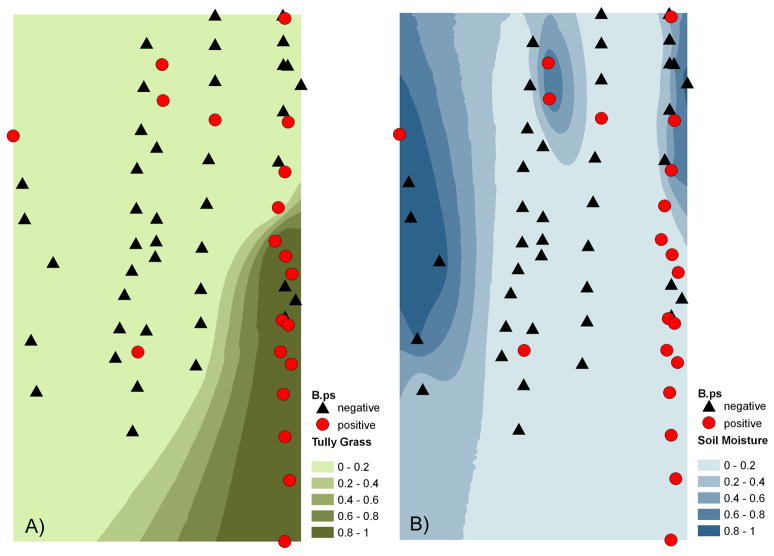
Figure 1.
At field site E which was rich in exotic Tully Grass, soil samples positive for B. pseudomallei are shown together with clusters of Tully Grass (A) or moist soil (B). The circles indicate the results of soil screening for presence of B. pseudomallei over two consecutive dry seasons. A) The cluster of Tully Grass along the southeast edge is shown by a map based on Indicator Kriging which predicts the probability that the threshold value 0 for no presence of Tully Grass is exceeded. B) Probability map for moist to wet soil (approx. >200 mV or >4% vol soil water content).

