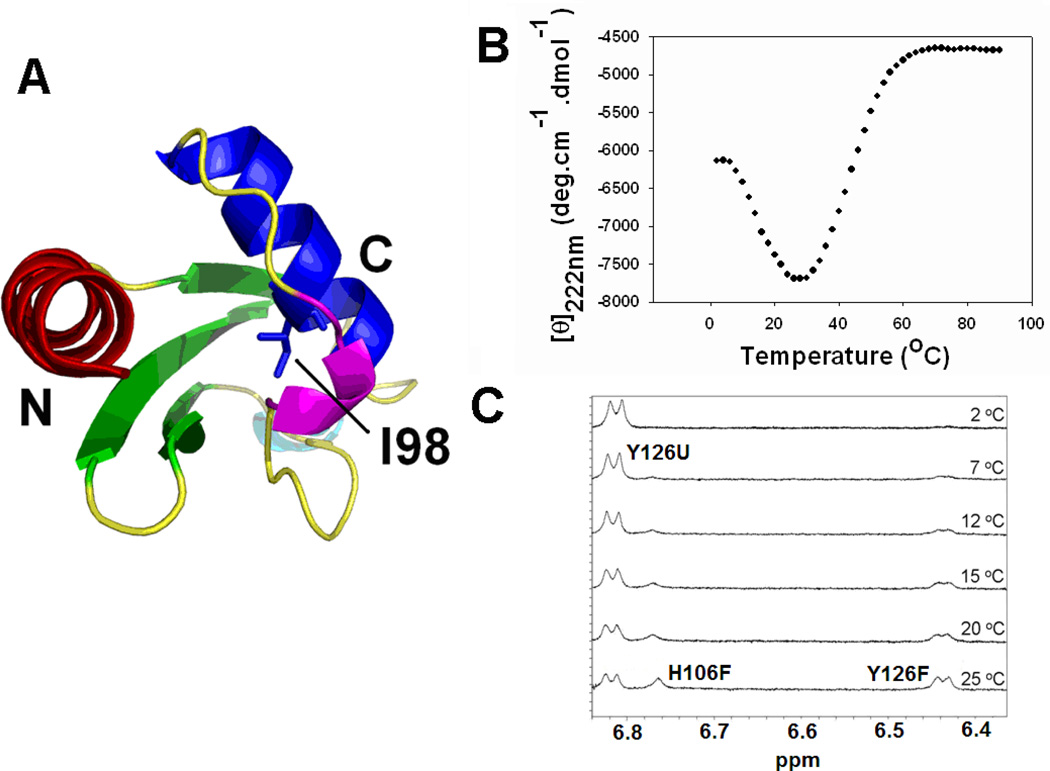
Figure 1.
The I98A mutant undergoes cold denaturation. (A) Ribbon diagram of CTL9 (residues 58–149 of protein L9), Protein data bank entry 1DIV. The hydrophobic core residue I98 as well as the N and C-termini are labeled. The ribbon diagram was made using PyMol. (B) Thermal denaturation curve of I98A CTL9 monitored by CD at 222 nm in H2O at pH 5.7. (C) 1D 1H-NMR spectra of I98A CTL9 at different temperatures in 100% D2O at pD 6.0 (uncorrected pH meter reading). Only the aromatic region is shown, resonance assignments are labeled.

