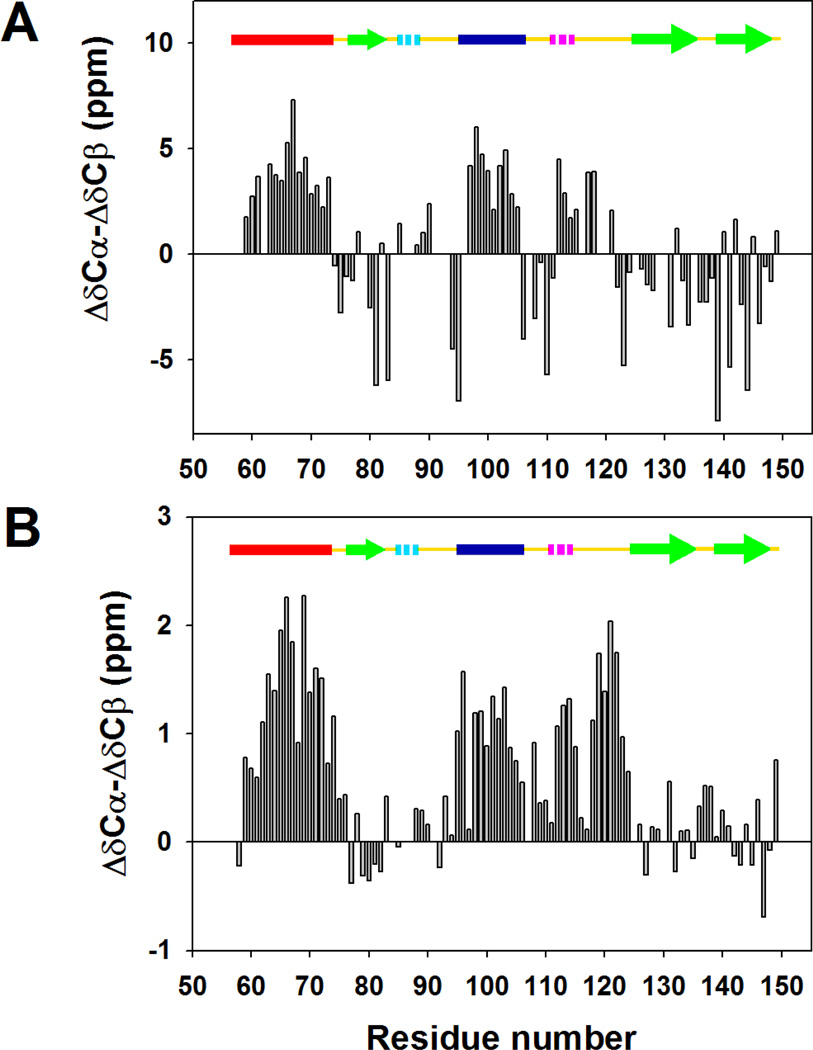
Figure 3.
Plots of the difference in the 13Cα secondary shifts and the 13Cβ secondary shifts for (A) The native state of wild-type CTL9, (B) the cold denatured state of I98A CTL9. Note that the scale is different in panel A and panel B. Assignments were obtained at pH 5.7, 12 °C. A schematic diagram of the elements of secondary structure of the native state of CTL9 is shown at the top of each panel, with solid bars, hashed bars, and open arrows indicating alpha-helix, 3–10 helix and beta-strand structure, respectively. The color coding corresponds to that used in Figure 1.

