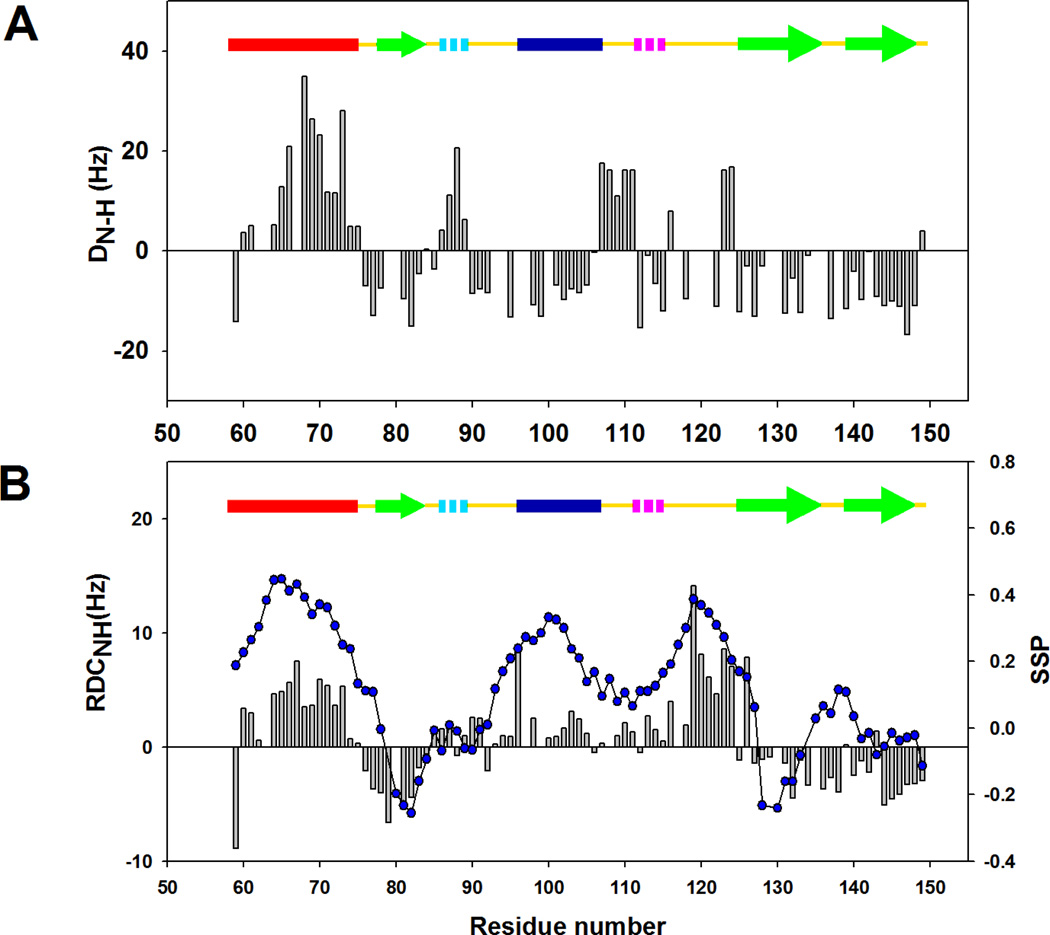
Figure 5.
Residual dipolar couplings for CTL9 and the I98A mutant. Measurements were made at pH 5.7, 12 °C. (A) Plot of DNH for the wild-type CTL9 versus residue numner. (B) Plot of DNH (black bars) and SSP scores ( ) for I98A CTL9 versus residue number. A schematic diagram of the elements of secondary structure of the native state of CTL9 is shown at the top of each panel.

