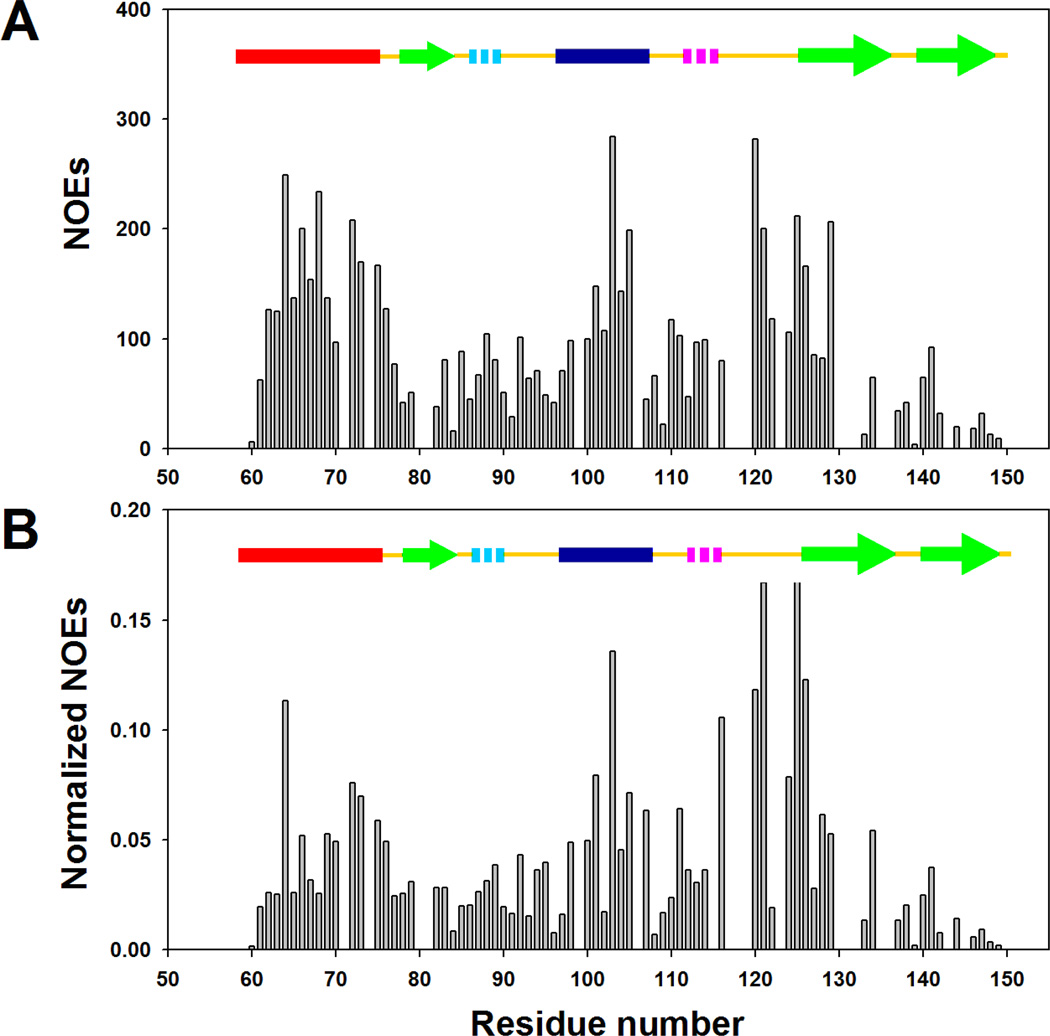
Figure 6.
Summary of NOEs observed for I98A CTL9 at pH 5.7, 12 °C. (A) Plot of the volume of the sequential amide proton NOEs versus residue number. (B) Plot of normalized sequential amide proton NOEs versus residue numner. Peak volumes are normalized as the ratio of observed dNN(i,i+1) NOE crosspeaks to the diagonal peaks.

