An official website of the United States government
Here's how you know
Official websites use .gov
A
.gov website belongs to an official
government organization in the United States.
Secure .gov websites use HTTPS
A lock (
) or https:// means you've safely
connected to the .gov website. Share sensitive
information only on official, secure websites.

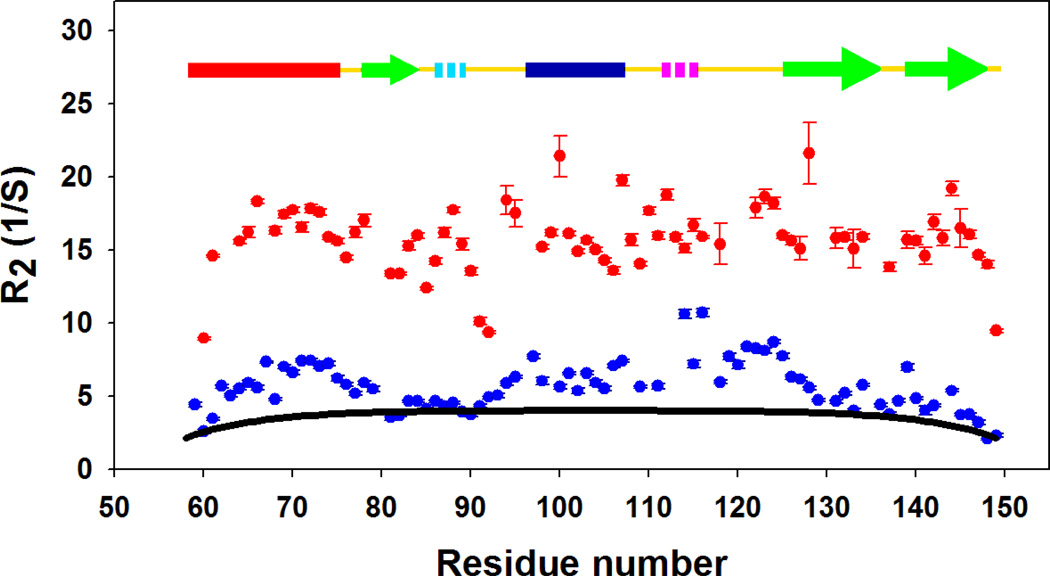
 ) and the cold denatured state of I98A CTL9 (
 ). The black solid line (−) is the best fit to the phenomenological model of Schwalbe and coworkers. Data was collected at 12°C for both proteins.