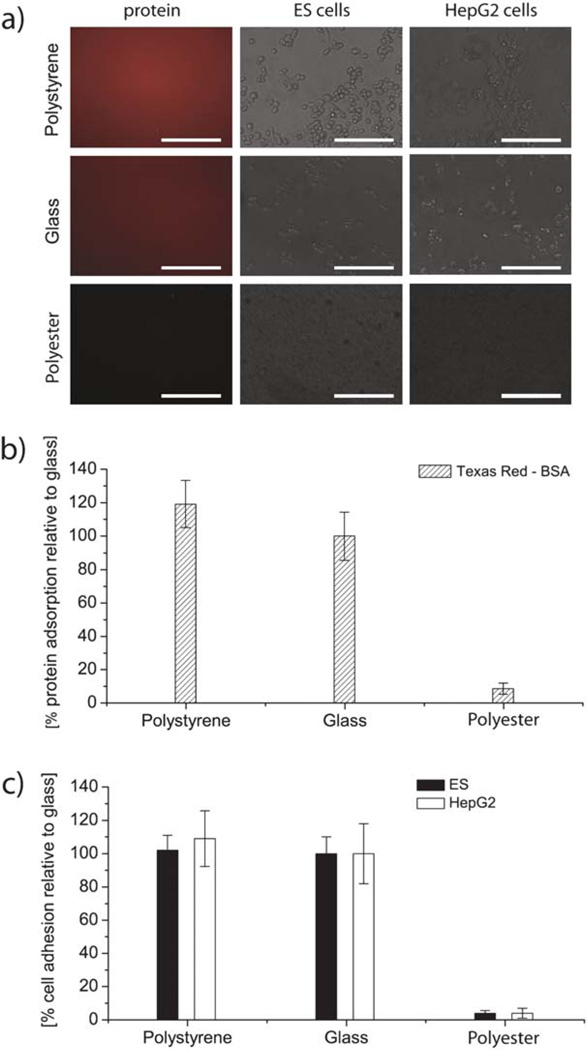
Fig. 4.
Cell adhesion after 4 hours of incubation and protein adsorption after 20 min of incubation on polyester film. (a) Fluorescence and phase images of protein and cell coated polyester, polystyrene and glass. Scale bars are 150 µm. (b) Protein adsorption and (c) cell adhesion expressed in percentages relative to adhesion and adsorption on untreated glass and compared to polystyrene. The error bars are the standard deviation across three independent experiments. The differences between cell and protein adhesion values on polyester and glass and between polyester and polystyrene are statistically significant, as p < 0.05 in all cases.

