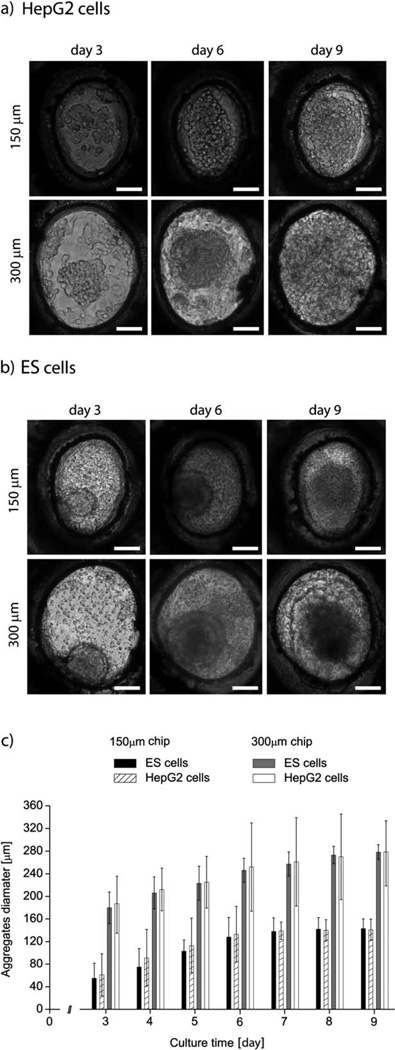
Fig. 5.
Representative images of aggregates formed by HepG2 (a) and ES cells (b) on days 3, 6 and 9 of cell culture and in the 150 and 300 µm wells. (c) Increase in the aggregate diameters of HepG2 and ES cells. All experiments were conducted in triplicate. The reported values are averages across 100 wells per device and three devices, and the error bars represent the standard deviation. All scale bars are 150 µm.

