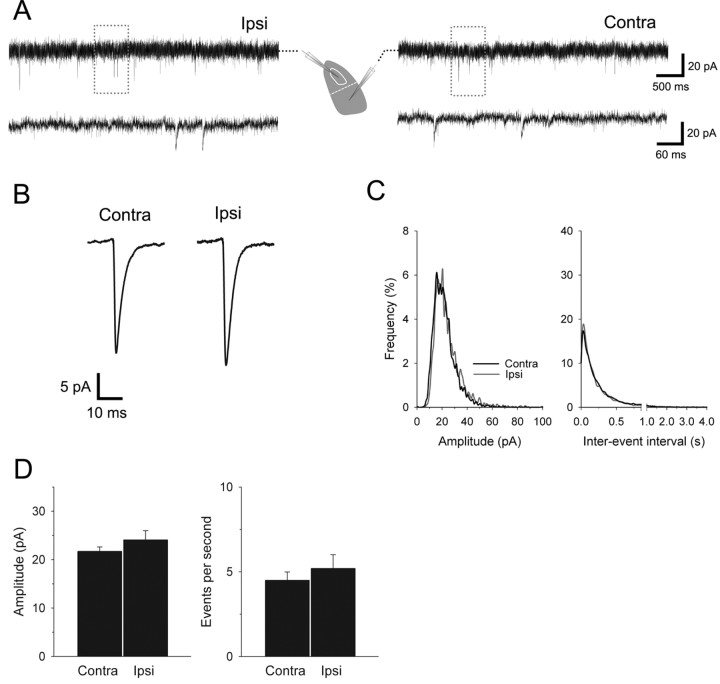
Figure 3.
mEPSC amplitude and frequency of normally reared mice. A, Representative whole-cell voltage-clamp mEPSCs recorded from two relay cells in dLGN regions receiving input from the contralateral (Contra) or ipsilateral (Ipsi) eye. The accompanying diagram depicts target regions. The mEPSCs were recorded between P19–P21 in TTX (1 μm) and BIC (25 μm) at a holding potential of −70 mV. Highlighted sections are expanded in time below each trace. B, Average mEPSCs recorded from contralateral and ipsilateral eye regions. C, Frequency histogram plots of mEPSC amplitude (left) and frequency (right) for contralateral (black) and ipsilateral (gray) eye regions. D, Group-averaged mEPSC amplitude (left) and frequency (right). Error bars depict SE. No significant differences were observed in mEPSCs amplitude or frequencies (t test, p > 0.2, for both comparisons). Contralateral, n = 24 cells; ipsilateral, n = 9 cells; from five animals.

