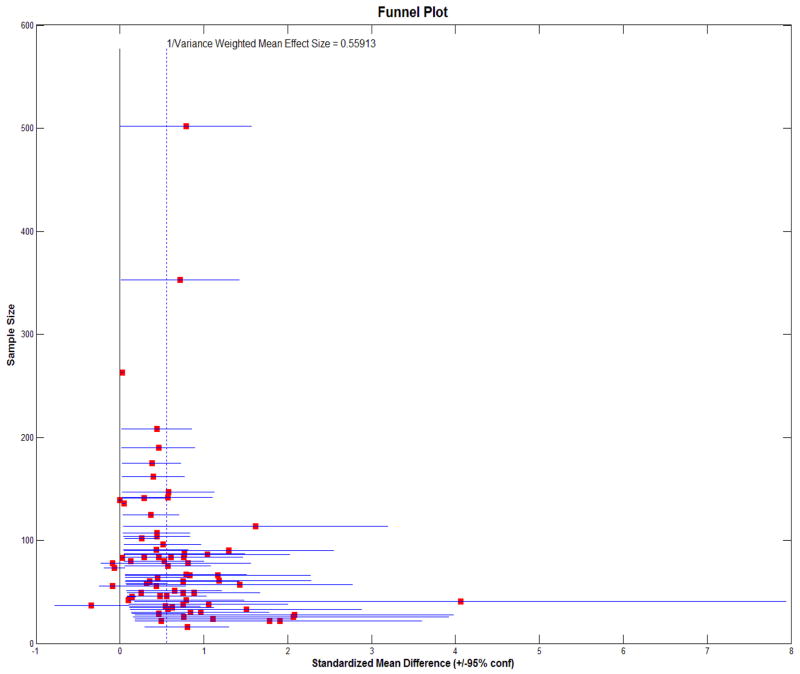
Figure 3.
A funnel plot of VBR study effect size (+/− 95% confidence intervals) against study sample size. The vertical dashed line represents the weighted mean effect size across studies. Assessment of study VBR effect size variability was obtained using the Q-statistic (Higgins and Thompson 2002); Q = 231.46, df = 71, p< 0.0001.

