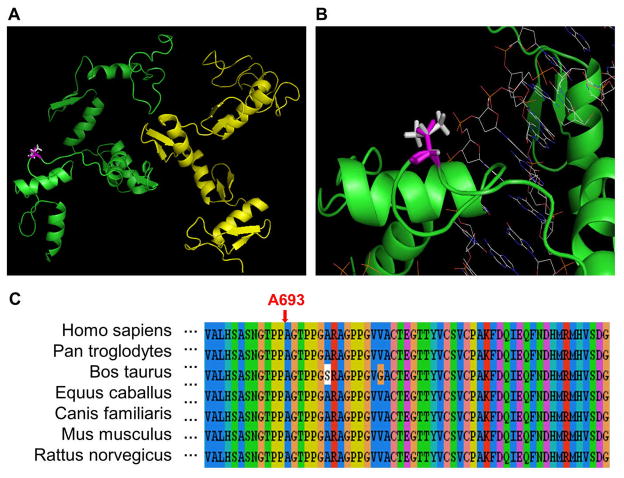
Figure 4. Illustration of the A693V mutation in human ZBTB20.
a) Structural representation of the A693V mutation. Chains A and B are shown in green and yellow, respectively. Ala 693 (wild-type) is shown in magenta, and Val 693 (mutant) in white.
b) Representation of the modeled structure of ZBTB20 in complex with DNA. Shown are chain A in green, Ala 693 in magenta, Val 693 in white, and the DNA molecule as wireframe.
c) Multiple sequence alignment of ZBTB20 with the amino acid substitution site indicated.

