Figure 6.
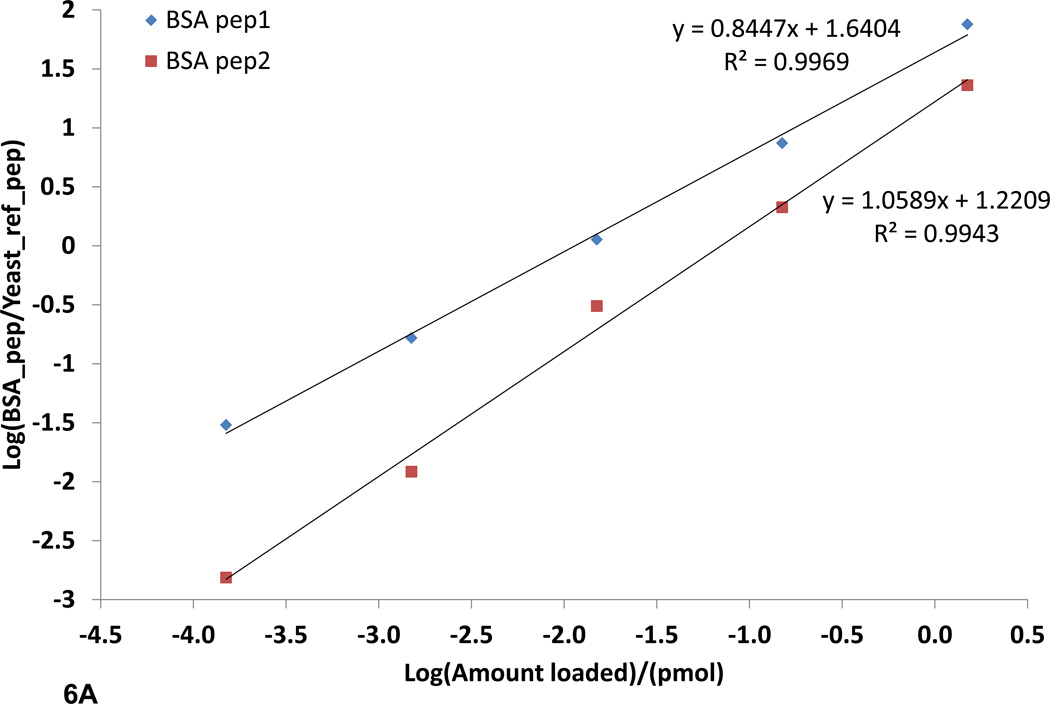
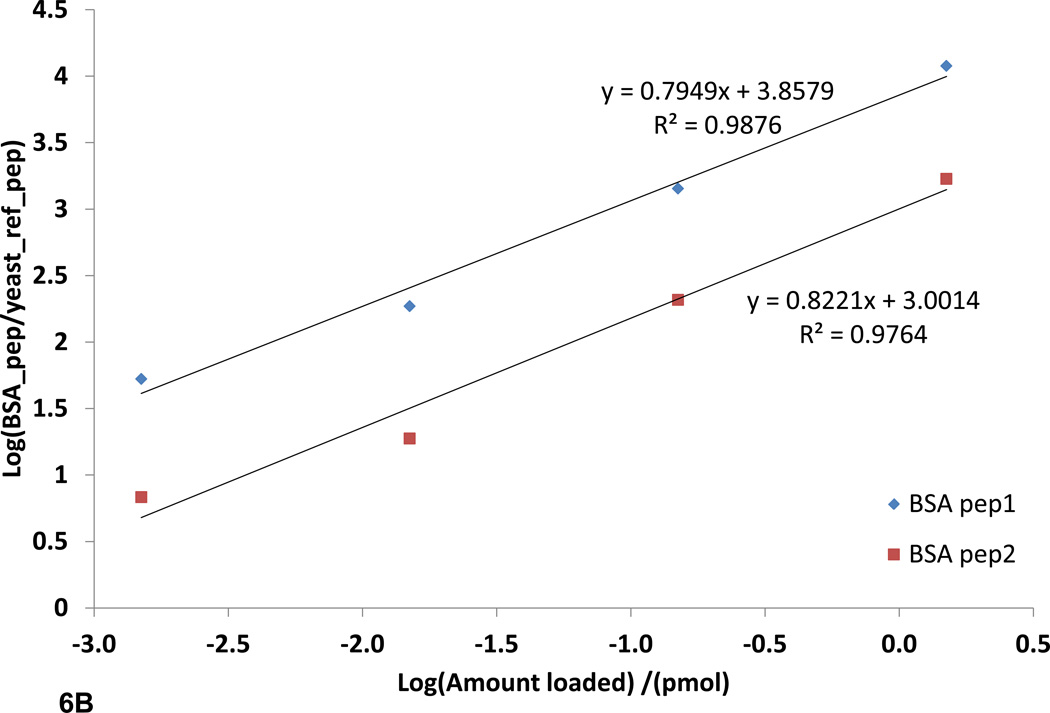
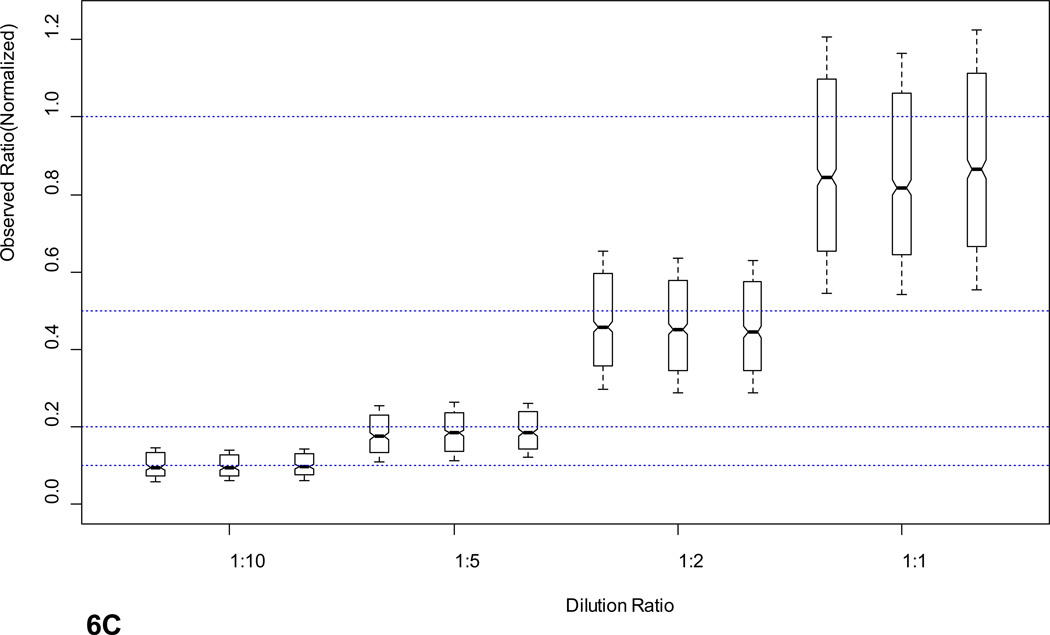
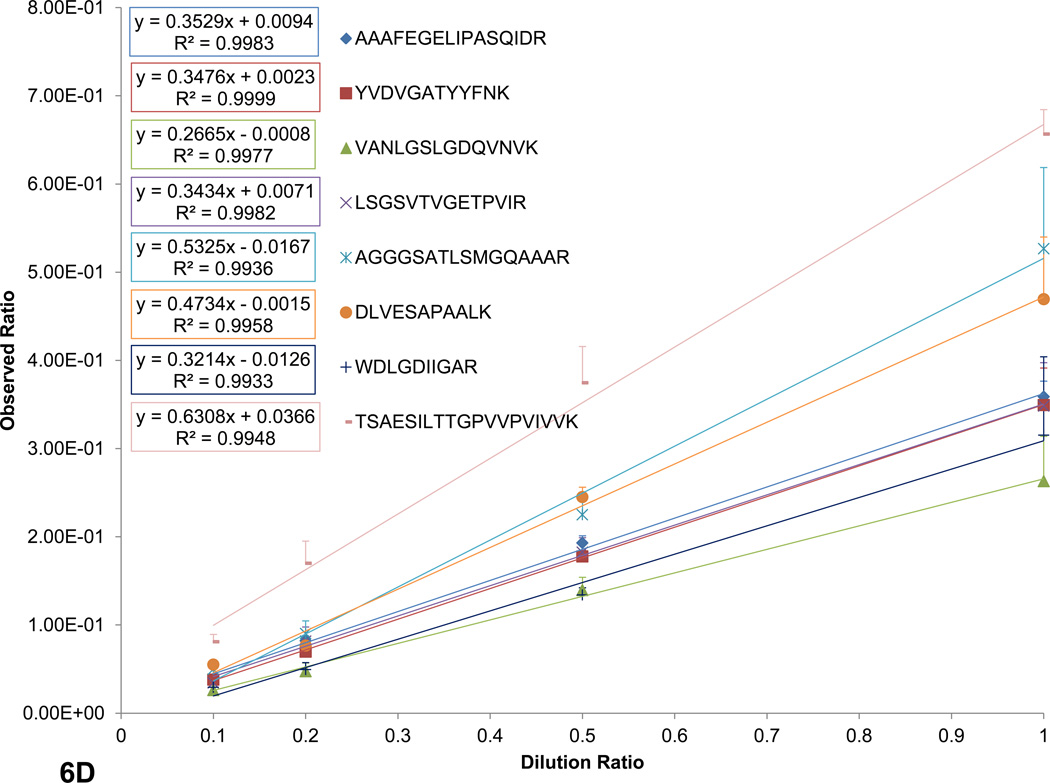
SRM and FT-ARM quantification of BSA digest spiked into yeast whole cell lysate digest (DAFLGSFLYEYSR and VPQVSTPTLVEVSR). A) Integrated area as function of concentration of BSA peptides using SRM. B) Integrated score area as function of concentration of BSA peptides using FT-ARM. C) Box and whisker plot for all peptides quantified from E. coli at <5% FDR normalized to 1. D) Random selection of peptides from the E. coli dataset in linear regression format of the average +/− σ at each dilution.


