


Table 1.
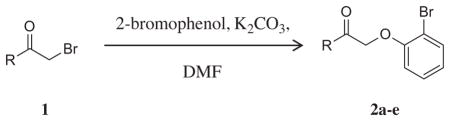
Initial SAR for mGlu4 PAM VU0219493
| |||
|---|---|---|---|
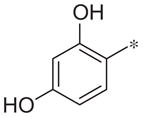
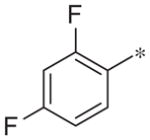
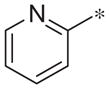
| Compd | R | hmGlu4 EC50 (μM)a | Efficacy %PHCCC |
| 2a |
|
1.4 ± 0.4 | 79.0 ± 3.1 |
| 2b |

|
Inactive | 12.1 ± 3.1 |
| 2c |
|
Inactive | 12.2 ± 4.7 |
| 2d |
|
4.6 ± 1.4 | 81.9 ± 2.7 |
| 2e |
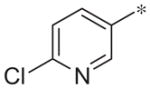
|
Antagonistb(IC50 = 7.8) | %Inhibition 74.4 |
a
Potentiation EC50 and efficacy (% PHCCC) are the average of at least three independent determinations performed in triplicate (mean ± SEM shown in table). The maximal response generated in mGlu4 CHO cells in the presence of mGlu4 PAMs varies slightly in each experiment; therefore, PAM data are normalized to a control PAM, PHCCC, response obtained in each day’s run.
b
For 2e, potency and efficacy (% inhibition) data are for blockade of an EC80 glutamate response.