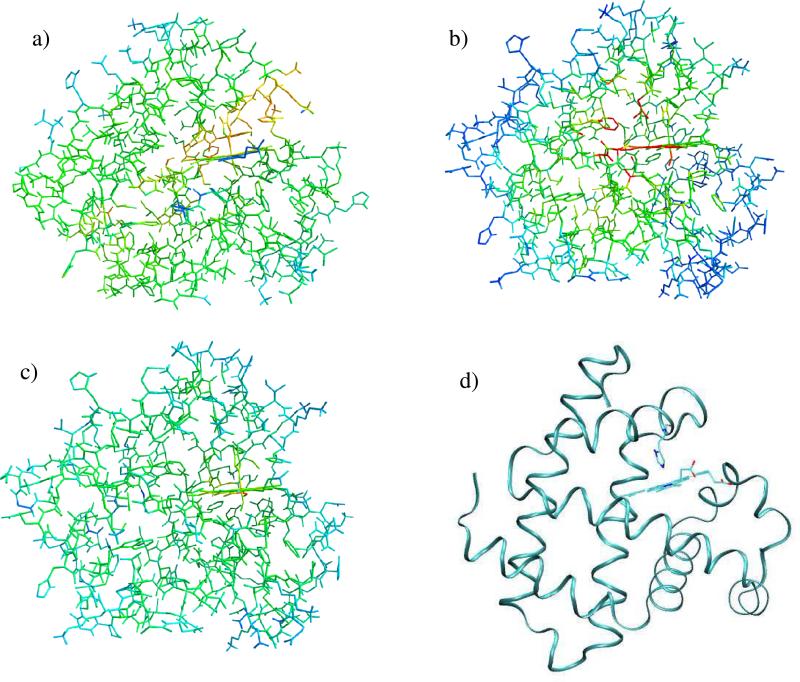
Figure 10.
Color-coded variance of the local temperature of myoglobin in the stationary condition under constant illumination. (a) Native; (b) V68W mutant; (c) L29F. Red color corresponds to the highest variance in temperature, followed by yellow and green; the blue color corresponds to the lowest variance. The temperature is computed on a grid of 30 × 30 × 30 points. (d) Myoglobin in ribbon representation, same orientation as in panels a-c. The heme and the proximal hystidine are represented in sticks.The figure was prepared with ZMOIL41 and VMD48 programs.

