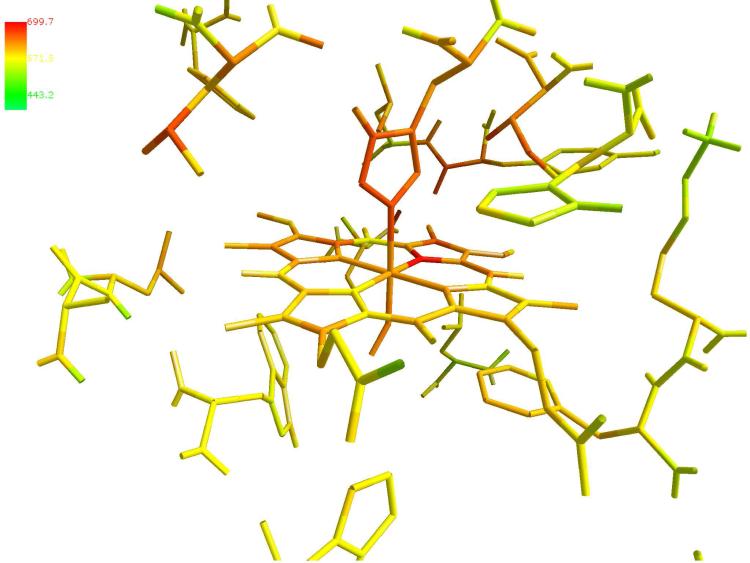
Figure 11.
Color-coded variance of the local temperature of the heme and surrounding residues in V68W. The temperature is computed on a higher resolution grid of 60 × 60 × 60 points. The heme and the residues are represented in sticks. The figure was prepared with ZMOIL41 program

