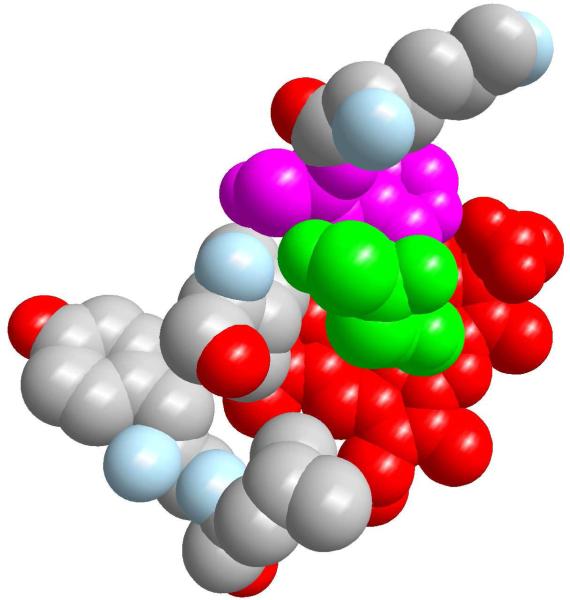
Figure 12.
Top view from the proximal direction of the core of temperature fluctuactions in the native protein (red: heme, green: proximal residue, on top of the heme, pink: His97). Lys96, Ile99, Tyr103 and Leu104 are represented and color coded by atom types: gray is an apolar carbon, red oxygen and light blue nitrogen. Atoms are drawn with only 85% of their van der Waals radius for clarity. The figure was prepared with ZMOIL.41

