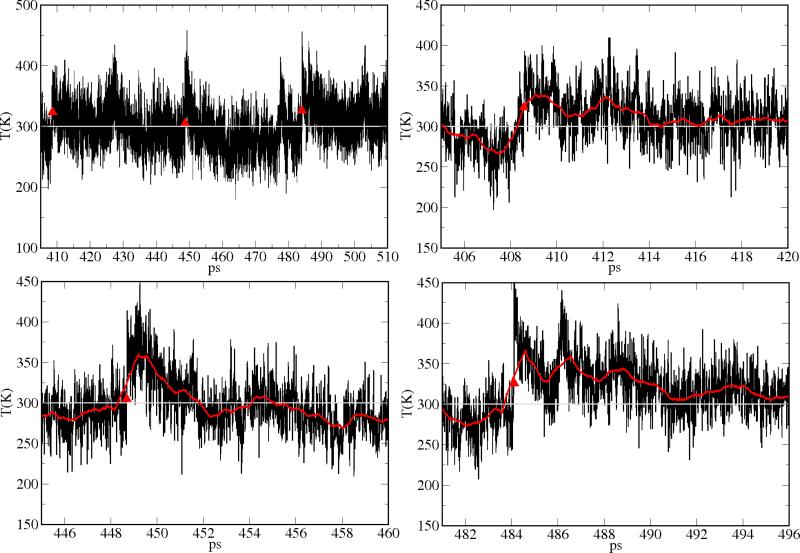
Figure 14.
Upper left panel: heme temperature in the 405-510ps time window, along the continuous illumination trajectory for the V68W system. Upper right panel: 405-420ps time window; bottom left panel: 445-460ps time window; bottom right panel: 481-496ps time window. Red symbols denote photon absorption events. Red curves are window averages over 0.1ps.

