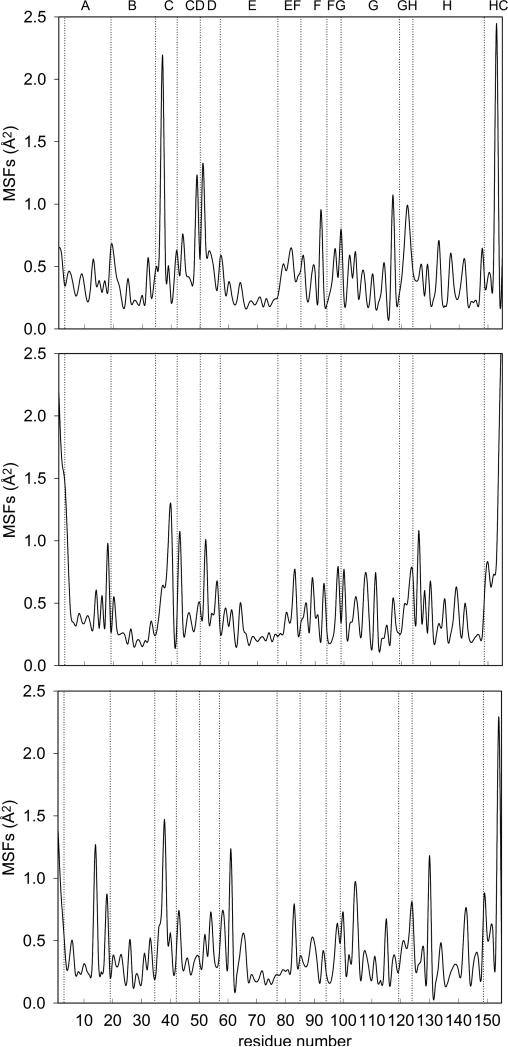
Figure 5.
Atomic mean square fluctuations versus residue number, Eq. (17). Upper panel: native Mb; central panel: V68W mutant; lower panel: L29F mutant. The labels at the top of the plot indicate secondary structure elements in Mb: helix A (residues 3 to 18), helix B (20 to 35), helix C (36 to 42), loop CD (43 to 50), helix D (51 to 57), helix E (58 to 77), loop EF (78 to 85), helix F (86 to 94), loop FG (95 to 99), helix G (100 to 118), loop GH (119 to 124), helix H (125 to 148), carboxyl terminus HC (149 to 153).

