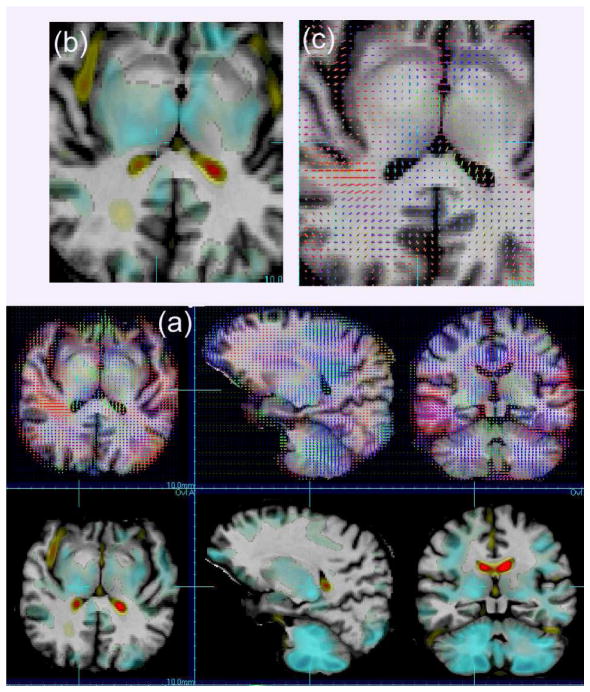
Fig. 3.
(a) A comparison of the effect maps for the difference between groups (abstainers vs relapsers) for the scalar volume change maps (bottom) and the directional models (top). Directional effects are shown by three effect vectors whose length indicates the relative size of the effect and the colour indicates direction of effect. Enlargements of an area are shown for one slice in (b) and (c).

