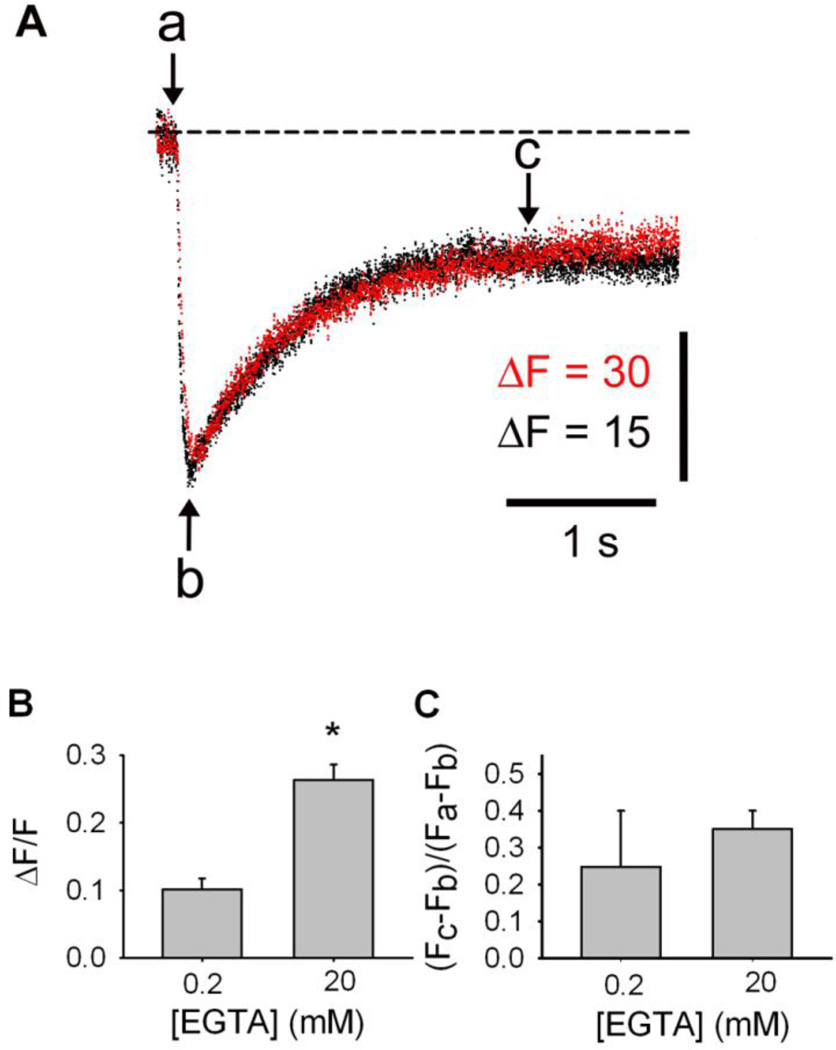
Figure 2. High cytosolic EGTA concentration increases CatchER transient amplitude but does not affect SR Ca2+ recovery.
A. SR Ca2+ transients recorded in electroporated FDB fibers and recorded in whole cell patch-clamp using 0.2 (black trace) or 20mM (red trace) EGTA in the pipette solution. B. CatchER ΔF/F – [EGTA] relationship. CatchER fluorescence at nadir of the response (b) is significantly larger in 20 than 0.2mM EGTA (p < 0.001, n = 11 in 0.2 mM EGTA; n = 13 in 20mM EGTA). C. SR Ca2+ recovery is expressed as (Fc-Fb)/(Fa-Fb), where a is the average of the basal fluorescence points, and b and c are CatchER fluorescence at nadir and 2s after repolarization starts, respectively. SR Ca2+ recovery is independent of cytosolic [EGTA] (p > 0.05).

