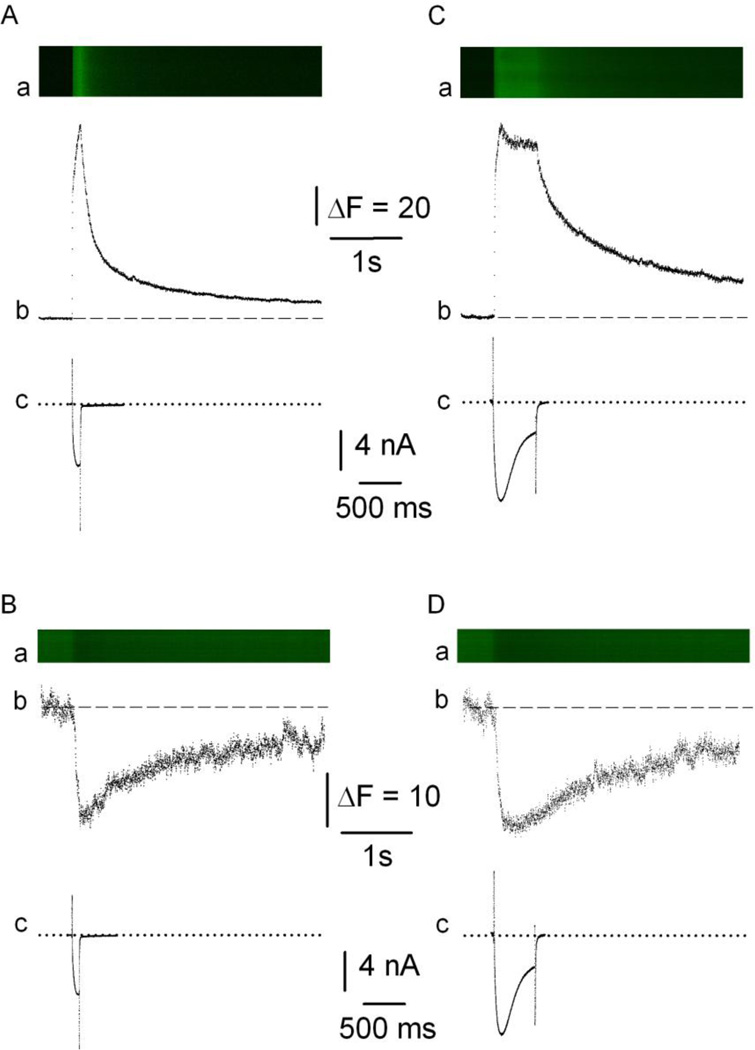
Figure 4. SR and cytosolic Ca2+ transients recorded in the same FDB fibers.
Ca2+ transients were recorded in response to a command pulse (20mV and 100-ms [A, B] or 500-ms [C, D] duration [Vh = −80mV]). Panel a shows images in confocal line-scan mode with vertical and horizontal axes corresponding to space and time, respectively; b, Ca2+ transients’ fluorescence profile measured with Rhod-2 (A, C) or CatchER (B,D); c, Ca2+ currents. Dashed and dotted lines indicate basal fluorescence before pulse application and isoelectric current, respectively. ΔF/F for Ab, Bb, Cb, and Db were 6.65, 0.26, 6.7, and 0.28, respectively. The rising phase of the Rhod-2 signal was fitted to an exponential function with two time constants of 3 and 146ms and 4 and 246ms in response to 100 and 500 ms pulses, respectively. The decay phase also shows two time constants of 114 and 1025ms and 159 and 1246, respectively. Time to peak is 98 and 111ms, respectively. The CatchER rising and recovery phases were fitted with a single time constant of 31 and 23ms and 1214 and 2733 in response to 100 and 500 ms pulses, respectively. Time to peak is 100 and 127ms, respectively.

